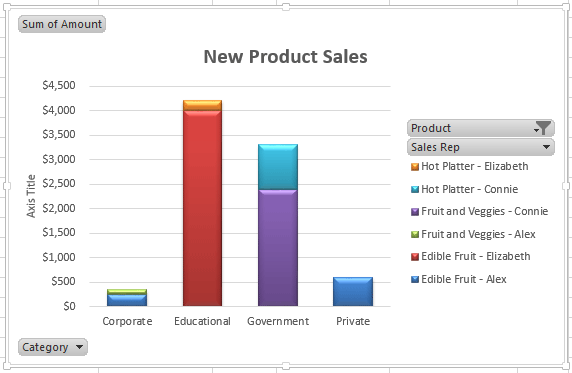
Excel 2013: Analyzing Data Visually Pivot Charts: What Do You See? 1. Readings Read Lesson 4 in the Advanced Excel guide, page 119-159. Watch the video. . Project A spreadsheet that uses PivotCharts to present the data in an interactive format. Downloads Sales 2013 Original Data.xlsx Brown Bag Sales Data.xlsx 2. Practice Complete the Practice Activity on page 160. 3. Assessment Review the Test questions, page 160.
A spreadsheet that uses PivotCharts to present the data in an interactive format.
Sales 2013 Original Data.xlsx
Brown Bag Sales Data.xlsx
Complete the Practice Activity on page 160.
Review the Test questions, page 160.